Clojure bites - Profiling with Tufte
by FPSD — 2023-08-31
Overview
If we have a system in production it is quite common to want to understand how many resources it is using as a whole and for each of its components; this information can be used to plan how much hardware we have to provision or to optimize the costs, identifying expensive "code paths" and planning some work to optimize its operational costs. Another use of this information is resource monitoring, finding performance regressions after we have deployed some changes to our systems.
To collect this information we can use tufte, a profiling library, and to send collected metrics to a event/log collector we can use mulog which makes it easy to log data instead of text messages that we would need to parse later. (see HERE for an introduction to mulog) In this post we are going to use Opensearch but the same approach can be easily ported to other tools or even IaaS/PaaS.
The plan
There is a lot to do, so better to lay out a plan, it is not important if it is not super well defined and should work to help me to not go out of the track:
- Introduce tufte and apply it to some sample code.
- Create an api or webpage using ring + reitit that uses the code that we are profiling.
- Add a middleware to the router to log with mulog, writing to file.
- Collect metrics and log them periodically.
- Setup Opensearch and log to it.
- Show logs and potentially a dashboard.
Introducing Tufte
Taking from the project's README:
Tufte allows you to easily monitor the ongoing performance of your Clojure and ClojureScript applications in production and other environments.
It provides sensible application-level metrics, and gives them to you as Clojure data that can be easily analyzed programmatically.
I don't think there is a better way to describe it so I will not try.
No, ok, I will try. In our context it can be seen as a tool to collect metrics about our system, at runtime, with low overhead, and to work on them (the metrics) as pure data to do, well, whatever we want to, for example logging that data somewhere to be used later or directly fire alarms if some part of the system is not behaving as expected.
This looks interesting in theory but how does it look in practice?
First of all we have to add tufte to our dependencies, as of today
the current version is 2.6.0, so we can add the dependency like so:
{:deps {com.taoensso/tufte {:mvn/version "2.6.0"}}}
Now we can run a tiny experiment to get a taste of the data we can get; first of all lets pretend we want to profile the good old FizzBuzz, for which we have two implementations:
  (ns codes.fpsd.fizzbuzz
    (:require [clojure.core.match :refer [match]]))

  (defn fizz-buzz-match
    [n]
    (match [(mod n 3) (mod n 5)]
           [0 0] "FizzBuzz"
           [0 _] "Fizz"
           [_ 0] "Buzz"
           :else n))

  (defn fizz-buzz-cond
    [n]
    (let [m3 (mod n 3)
          m5 (mod n 5)]
      (cond
        (and m3 m5) "FizzBuzz"
        m3 "Fizz"
        m5 "Buzz"
        :else n)))
Now we can profile it:
  (ns codes.fpsd.perf-log-es
    (:require [taoensso.tufte :as t]
              [codes.fpsd.fizzbuzz :as fb]))

  ;; Request to send `profile` stats to `println`:
  (t/add-basic-println-handler! {})

  (t/profile
    {}
    (dotimes [_ 50]
      (t/p :fizz-buzz-match (fb/fizz-buzz 10000))

      (t/p :fizz-buzz-cond (fb/fizz-buzz-cond 10000))))
Which will output something like:
pId                  nCalls        Min      50% ≤      90% ≤      95% ≤      99% ≤        Max       Mean   MAD      Clock  Total

:fizz-buzz-match         50     9.01μs     9.46μs    12.19μs    16.52μs   165.84μs   305.55μs    16.47μs  ±71%   823.61μs    31%
:fizz-buzz-cond          50     8.08μs     8.48μs    12.03μs    13.02μs    84.26μs   150.11μs    12.41μs  ±46%   620.52μs    23%

Accounted                                                                                                          1.44ms    55%
Clock                                                                                                              2.65ms   100%
Lets break down what we did and what we got:
- We want to profile some code, in this case two FizzBuzz implementations
- We have told tufte to print its results; we will see later other way to get the numbers
- We have profiled the two functions
- And finally we got our results in a nicely formatted table which gives us an idea of what we can get from tufte
One thing to notice is that tufte only profiles CPU time and does not take into account memory usage; depending on our requirements it may be a deal breaker for needs, in that case we can track memory usage on the side with other tools or replace it completely.
Using the println handler may be enough when profiling something locally but for something running in a server (or cluster) it may be more convenient to log the metrics or apply some logic to collected metrics. For these use case there are two options:
- tufte/profiled
- tufte/add-accumulating-handler!
profiled
Like profile, it will run the enclosed forms but instead of directly returning the result of the form and send the pstats to the configured handler, it returns a tuple composed by:
- the value of the form
- a pstats object that can be inspected to collect the collected metrics
To have a better understanding of the output of profiled we can run the following form:
  (def res (t/profiled
               {}
             (dotimes [_ 50]
               (t/p :fizz-buzz-match (fb/fizz-buzz 10000))

               (t/p :fizz-buzz-cond (fb/fizz-buzz-cond 10000)))))

  (nth res 0) ;; => nil
  (deref (nth res 1)) ;; => continues...

  {:clock {:t0 30597219635504, :t1 30597220674063, :total 1038559},
   :stats {:fizz-buzz-match {:min 3973, :mean 5973.8, :p75 4196.75, :mad-sum 165725.20000000007, :p99 47871.74999999987, :n 50, :p25 4052.0, :p90 4959.9000000000015, :var 1.1782216812E8, :max 81400, :mad 3314.5040000000013,
                             :loc {:ns "codes.fpsd.perf-log-es", :line 20, :column 14, :file "/home/foca/work/playground/src/codes/fpsd/perf_log_es.clj"},
                             :last 81400, :p50 4116.5, :sum 298690, :p95 6182.649999999998, :var-sum 5.891108406E9},
           :fizz-buzz-cond {:min 3630, :mean 4549.58, :p75 3795.0, :mad-sum 71821.36000000004, :p99 14535.559999999994, :n 50, :p25 3707.0, :p90 4196.1, :var 7170650.4836, :max 15690, :mad 1436.427200000001,
                            :loc {:ns "codes.fpsd.perf-log-es", :line 22, :column 14, :file "/home/foca/work/playground/src/codes/fpsd/perf_log_es.clj"},
                            :last 15690, :p50 3735.5, :sum 227479, :p95 12587.149999999998, :var-sum 3.5853252418E8}}
   }
WOW, Now we are speaking! Look at that, we have a "raw" representation of what the println handler showed us but now we can work with it! For example we could directly rise alerts depending on some collected metric or send the whole or a sample of that data to a log collector. A recap of what we did and what we've got:
- we have profiled a form with profiled instead of profile
- we've got a tuple with the result of the form and the pstat object which contains
- total amount of time of the enclosed forms
- details of each p form, including percentile stas and the location of the code generating them
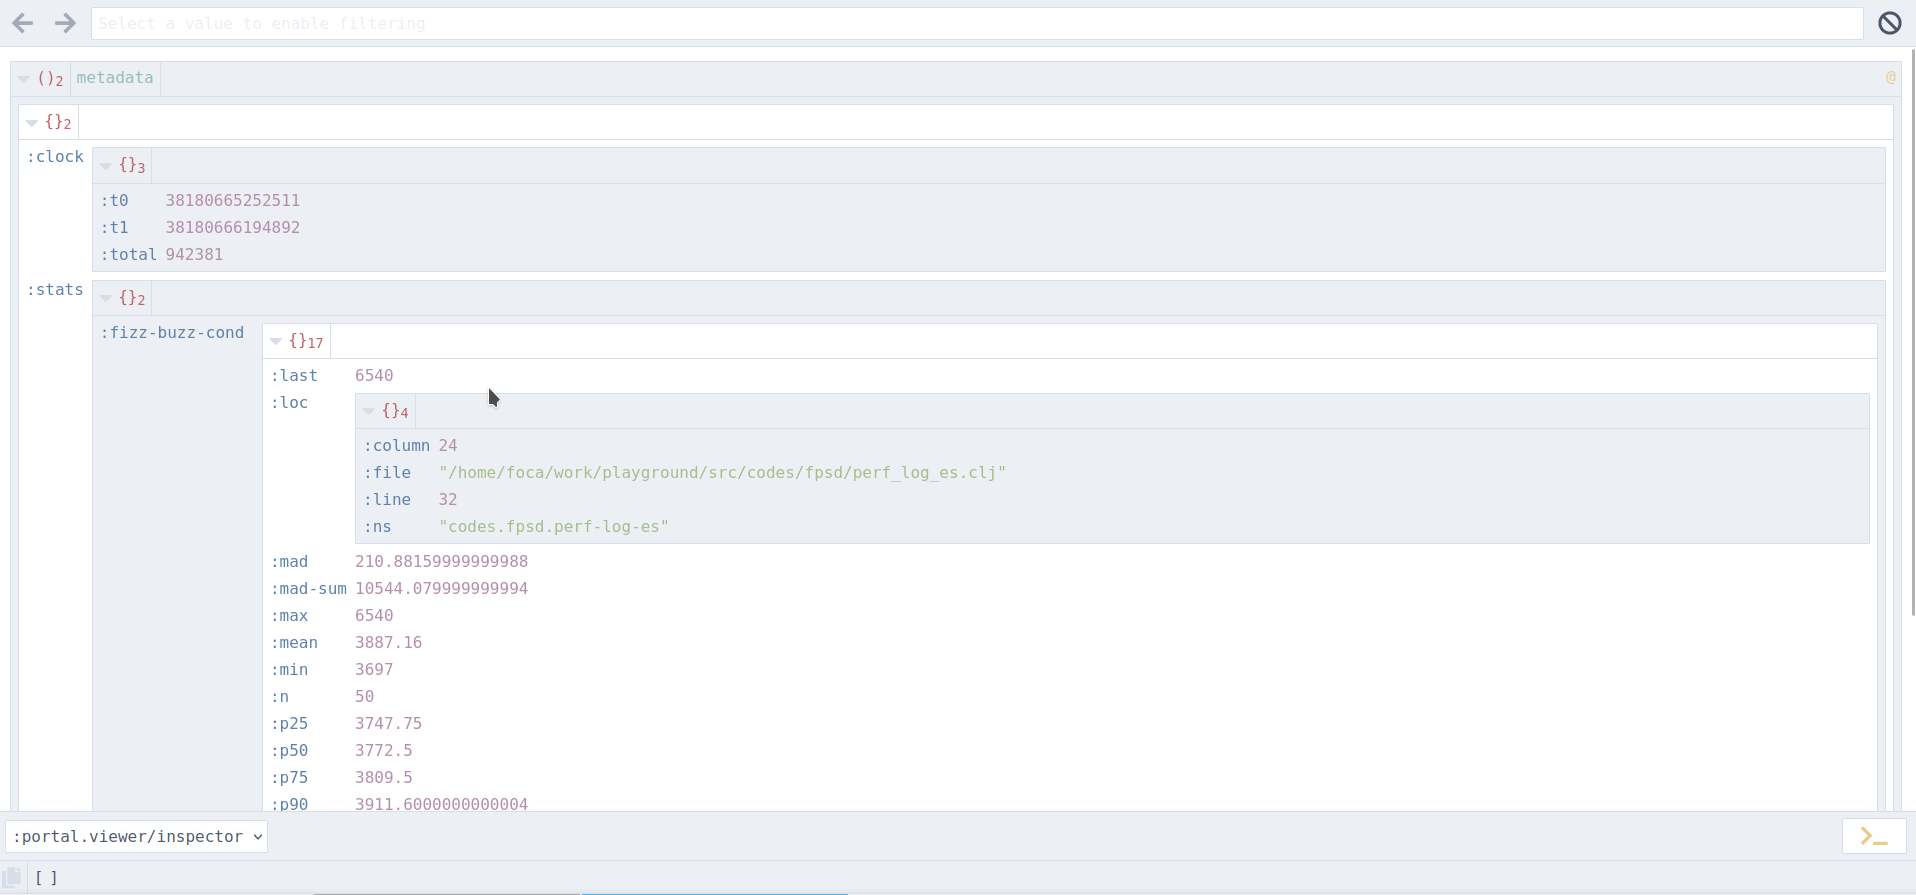
Inspecting pstats directly as shown in the previous example may not be the most convenient way to get value out of it, especially in a development environment; one handy way of collecting this data while working on some piece of code and profiling it, is to send pstats to Portal and use its powerful views to explore the data generated by tufte, here is an example view:

There are multiple ways to get tufte's pstats to portal but the simplest form "to get there" is something like:
  (require '[portal.api :as portal])
  (def p (portal/open))

  (add-tap #'portal/submit)

  (let [[res pstats] (t/profiled
                       {}
                       (dotimes [_ 50]
                         (t/p :fizz-buzz-match (fb/fizz-buzz 10000))

                         (t/p :fizz-buzz-cond (fb/fizz-buzz-cond 10000))))]
    (tap> res)
    (tap> @pstats))
Portal's docs have a section to work with tufte available here.
add-accumulating-handler!
It is not always ideal, or needed to consume pstats objects on the fly,
even if it is cheap it will still adds up to your business logic runtime
or endpoints' response times. To avoid this we can accumulate pstats and
consume that on demand or periodically (for example every minute).
tufte/add-accumulating-handler! will create a new pstats accumulator, returning it,
which can later be drained to get all collected stats to do, well, whatever we
want to, for example to log the accumulated stats somewhere. De-refing an accumulator
will return a map in the form of
{:profile-id pstat}
Like the pstat object returned by profiled, to access its content we must deref it; here is a simple example:
    (def accumulated-stats (t/add-accumulating-handler! {}))

    (t/profile
     {:id :testing-1}
     (dotimes [_ 50]
       (t/p :fizz-buzz-match (fb/fizz-buzz 10000))
       (t/p :fizz-buzz-cond (fb/fizz-buzz-cond 10000))))

    (t/profile
     {:id :testing-2}
     (dotimes [_ 50]
       (t/p :fizz-buzz-match (fb/fizz-buzz 20000))
       (t/p :fizz-buzz-cond (fb/fizz-buzz-cond 20000))))

    (doseq [[p-id pstats] @accumulated-stats]
      (tap> [p-id @pstats]))
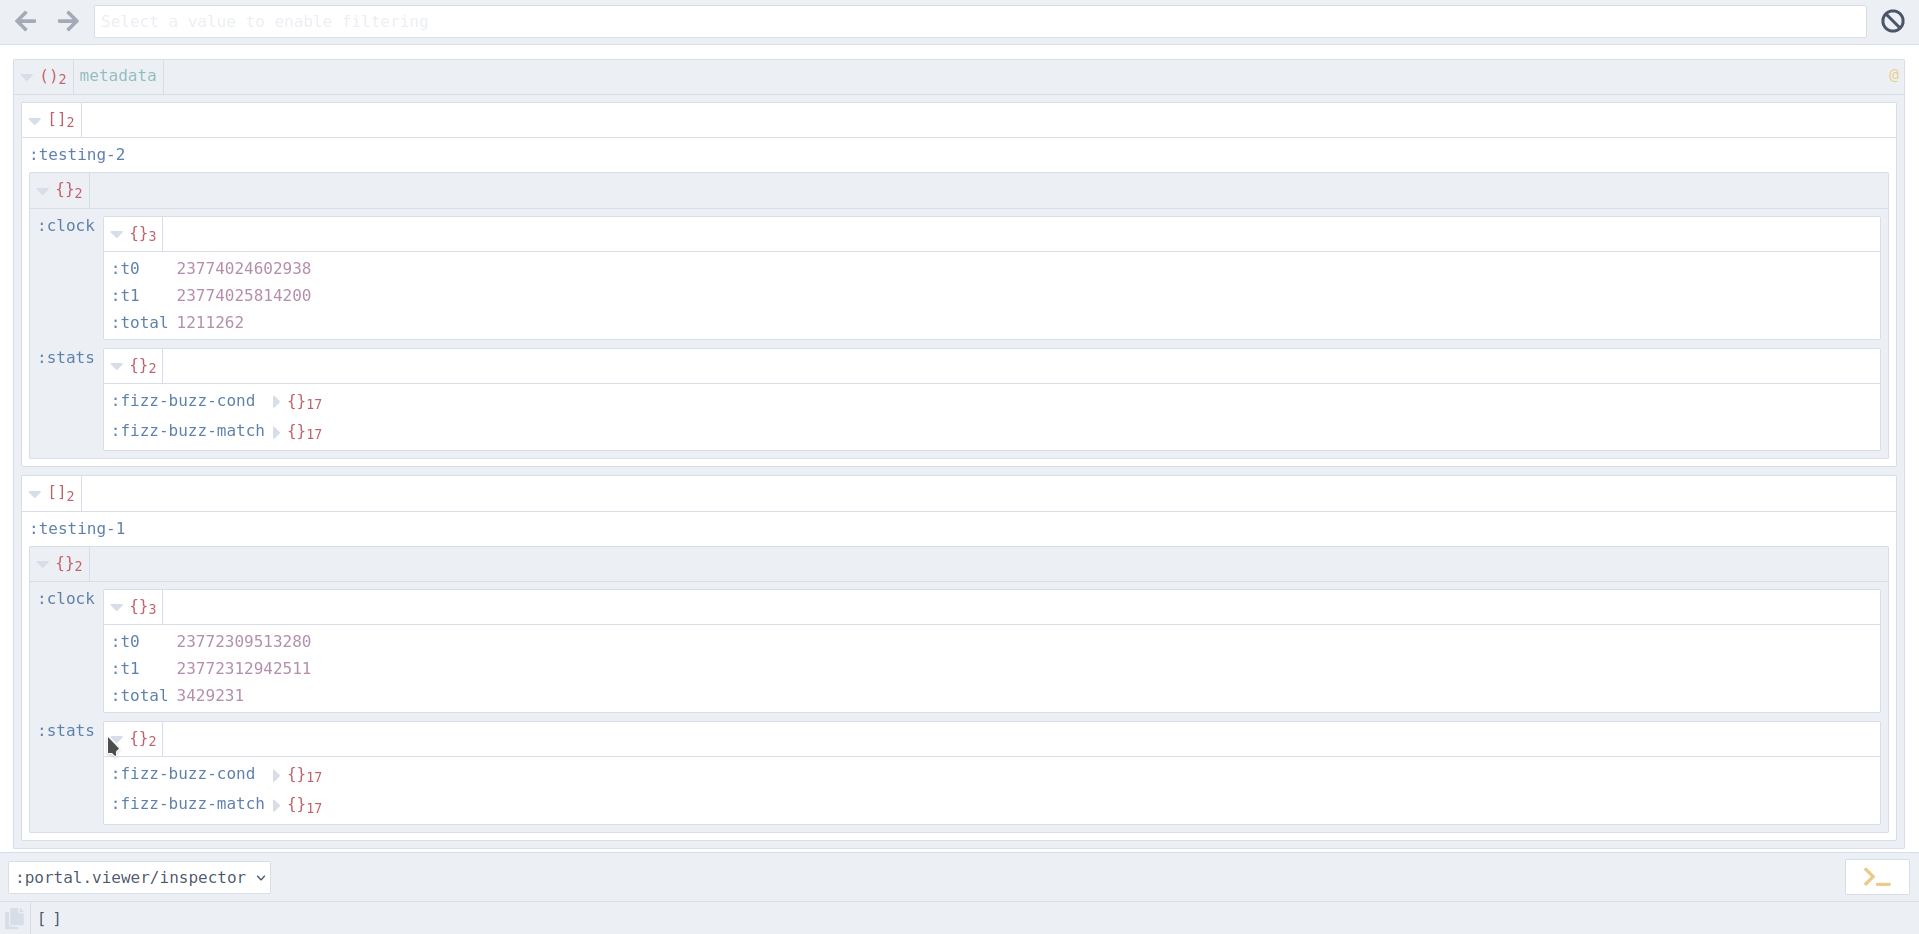
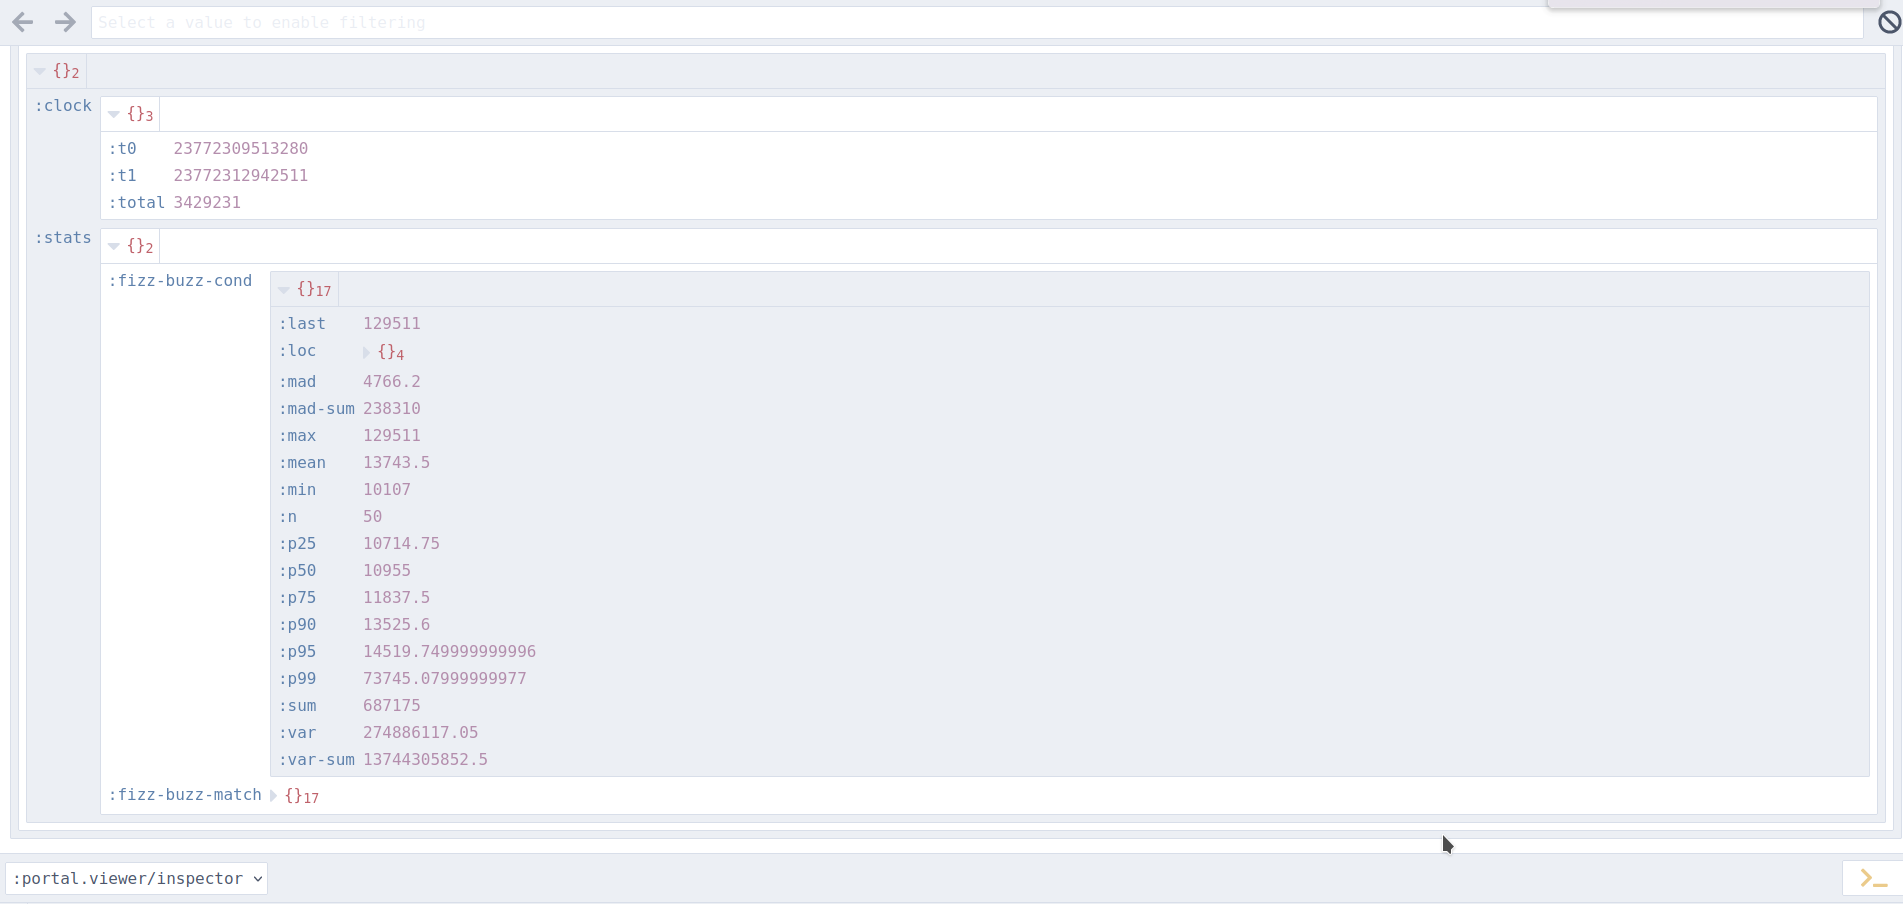
And here is how it looks in Portal:


Configuring Tufte
It is worth spending few words on how we can configure Tufte to fine tune it and to adapt it to our use case. We may have noticed that, profile, profiled and add-accumulating-handler! accept a configuration map which, excluding the last example, we left empty for simplicity. Here is a breakdown of the available configuration options.
profile, profiled, p:
:level: Optional profiling level, defaults to 5:when: Optional arbitrary conditional form that takes no arguments and return truty to enable profiling, falsy otherwise:id: Optional identifier provider to handlers (print or custom):data: Optional custom data to be provided to handlers
To be noted that the profiling level can be customized at runtime
by altering the var tufte/*min-level*, the JVM property taoensso.tufte.min-level
or the environment variable TAOENSSO_TUFTE_MIN_LEVEL.
Another configuration that will filter these forms is tufte/*ns-filter* which can
customized by using alter-var-root, or JVM property taoensso.tufte.ns-pattern or
the environment variable TAOENSSO_TUFTE_NS_PATTERN.
add-accumulating-handler!
:ns-pattern: same as the globaltufte/*ns-filter*but as per handler basis, useful to have different handlers for ns patterns
Refer to the docs to have the full picture about the configuring options.
Comparing the two options
profiled will return pstats to be used right away but we pay the price for each call to do something with the returned pstats, instead, add-accumulating-handler! will send accumulated pstats to an handler that will be drained at convenient times, we can think of it like an out of band process. It is nice to be able to have both behaviors available so that we can fine tune our profiling setup based on environments, namespace or custom conditions.
Small section about collecting data and log it with mulog
We have briefly seen how we can profile our code with tufte and get some data about it, we have also sent the data to portal which helps us to visualize it. This setup can be handy while developing however, we are still far away from an actionable setup where we can create or dashboards using the collected data. The missing pieces are:
- something to send the collected data "somewhere", for example mulog
- a "somewhere" that can ingest this data so that we can work with it, for example opensearch
Sending pstats to a log collector
Next sections are about setting Opensearch and mulog as a way to send profiling data "somewhere" else. If you are already familiar with these topics you can skip these details (or maybe read it anyway and help me to fix mistakes ;) ).
Opensearch
To simplify (quite a lot) we can setup a local single node opensearch, available at port 9200, with its nice dashboard, available at port 5601 accessible with admin:admin crendentials, using docker compose and the following docker-compose.yml:
    services:
      os-node1:
        image: opensearchproject/opensearch:2.3.0
        container_name: os-node1
        environment:
          - cluster.name=os-cluster
          - node.name=os-node1
          - discovery.type=single-node
          - bootstrap.memory_lock=true # along with the memlock settings below, disables swapping
          - "OPENSEARCH_JAVA_OPTS=-Xms512m -Xmx512m" # minimum and maximum Java heap size, recommend setting both to 50% of system RAM
        ulimits:
          memlock:
            soft: -1
            hard: -1
          nofile:
            soft: 65536 # maximum number of open files for the OpenSearch user, set to at least 65536 on modern systems
            hard: 65536
        volumes:
          - os-data1:/usr/share/opensearch/data
        ports:
          - 9200:9200
          - 9600:9600 # required for Performance Analyzer
        networks:
          - os-net
      os-dashboards:
        image: opensearchproject/opensearch-dashboards:2.3.0
        container_name: os-dashboards
        ports:
          - 5601:5601
        expose:
          - "5601"
        environment:
          OPENSEARCH_HOSTS: '["https://os-node1:9200"]'
        networks:
          - os-net

    volumes:
      os-data1:

    networks:
      os-net:
If we run this we can send our logs to localhost:9200 and point the browser to http:localhost:5601
to see logs and setup our dashboards and alerts. One litle extra step is needed
to be able to send logs to this dockerized opensearch setup. Given that it uses a self signed
certificate we must instruct mulog to ignore certificate validation errors and also
we must provide our credentials (admin:admin), this is easily done by adding the
following map to mulog's configuration:
  ;; extra http options to be forwarded to the HTTP client
  :http-opts {:insecure? true
              :basic-auth ["admin" "admin"]}
mulog uses the clj-http HTTP client library
so any setting provided in the :http-opts will be forwarded to that library when
making HTTP calls to send data to opensearch. These settings are neede because
the dockerized opensearch runs on HTTPS with a self signed cert (:insecure?)
and with basic auth credentials (:basic-auth); this is not a production grade
setup but is good enough to test locally.
mulog
mulog can help to send metrics to a collector and it has quite a lot of available publishers that can send logs to different type of systems like ElasticSearch, Opensearch and many others (see here for a full list).
For the purpose of this article lets focus on Opensearch for which can use the ElasticSearch publisher out of the box.
The bare minimum configuration needed to send events to Opensearch, considering our dockerized environment, is the following:
{:mulog/publisher {
  :type :elasticsearch
  ;; Elasticsearch endpoint (REQUIRED)
  :url  "https://localhost:9200/"

  ;; extra http options to pass to the HTTP client
  :http-opts {:insecure? true
              :basic-auth ["admin" "admin"]}
}}
This configuration will be the argument of com.brunobonacci.mulog/start-publisher!. To be
able to use this publisher we must also add one more dependency com.brunobonacci/mulog-elasticsearch
to our project.clj or deps.end.
We can start the publisher in our preferred way, manually or using an application state management library like integrant, component, mount and so on.
Putting it all together
So far we have seen:
- How to profile our code
- How to get pstats in different ways, on demando or accumulating it
- How to visualize that data
Now, finally, we can put it all together in a tiny example web app that sends the pstats to Opensearch. I'll try to keep it as simple as possible, to capture the important details.
;; web server setup with profiling middleware
(defn request->endpoint-name
  [request]
  (-> request :reitit.core/match :data (get (:request-method request)) :name))

(defn profiler-middleware
  "Middleware that wraps handlers with a call to t/profile
  using the endpoint name as the id of the "
  [wrapped]
  (fn [request]
    (t/profile {:id :ring-handler}
               (t/p (or (request->endpoint-name request) :unnamed-handler)
                    (wrapped request)))))

(defn fizz-buzz-handler
  "Ring handler that takes the number from the request path-params
  and returns a JSON with the resulf of calling fizz-buzz"
  [request]
  (try
    (let [number (-> request
                     :path-params
                     :number
                     Integer/parseInt)]
      (u/log :fizz-buzz-handler :argument number)
      {:status 200
       :body (json/generate-string {:result (for [n (range 1 (inc number))]
                                              (fb/fizz-buzz n))})
       :content-type "application/json"})
    (catch NumberFormatException e
      (u/log :fizz-buzz-handler :error (str e))
      {:status 400
       :body (json/generate-string {:error (str "Invalid numeric parameter " e)})
       :content-type "application/json"})))

(defn create-app
  "Return a ring handler that will route /events to the SSE handler
   and that will servr  static content form project's resource/public directory"
  []
  (ring/ring-handler
   (ring/router
    [["/fizz-buzz/:number" {:get {:handler fizz-buzz-handler
                                  :name ::fizz-buzz}}]
     ]

    {:data {:middleware [profiler-middleware
                         params/wrap-params]}})
   ))

;; define all integrant components

(defmethod ig/init-key :profiler/accumulator [_ config]
  (t/add-accumulating-handler! {}))

(defmethod ig/init-key :mulog/publisher [_ config]
  (u/start-publisher! config))

(defmethod ig/init-key :profiler/drain [_ {:keys [delay accumulator]}]
  (future
    (while true
      (Thread/sleep delay)
      ;; drain pstats if any
      (when-let [stats @accumulator]
        (doseq [[p-id pstats] stats]
          (doseq [[handler handler-stats] (:stats @pstats)]
            (let [{:keys [loc min max mad p95 p99]} handler-stats]
              (u/log :accumulator-drain :perf-id p-id :handler handler)
              (u/log p-id :handler handler :loc loc :min min :max max :mad mad :p95 p95 :p99 p99))))))
    (u/log :accumulator-drain-finished)))


(defmethod ig/halt-key! :profiler/drain [_ pstat-future]
  (future-cancel pstat-future))

(defmethod ig/init-key :http/server [_ config]
  (http/start-server (create-app) config))

(defmethod ig/halt-key! :http/server [_ server]
  (.close server))

;; and the configuration for all components of the system
;; being basically all "raw" data it can from an external
;; source like an edn file
(def config {:profiler/accumulator {}
             :profiler/drain {:delay 5000
                              :accumulator (ig/ref :profiler/accumulator)}
             :mulog/publisher {:type :elasticsearch
                               ;; Elasticsearch endpoint (REQUIRED)
                               :url  "https://localhost:9200/"

                               ;; extra http options to pass to the HTTP client
                               :http-opts {:insecure? true
                                           :basic-auth ["admin" "admin"]}}

             :http/server {:port 8080
                           :join? false}})

;; prepare the system, it will be intilialized only after
;; de-referencing the system var
(def system
  (delay (ig/init config)))
It is quite a lot of code! Lets break it down:
- We have setup a small web app with one endpoint that will return a list of the application of
fizz-buzzto numbers from 1 to:number - We have defined a middlware
profiler-middlewarethat will wrap any handler and will profile it - We spawn a thread that that, at defined times, will drain the stats accumulator and will log some stats using
mulogtargettingopensearch - Everything is setup using integrant
If we start the system we can test our new shiny API usung curl:
❯ curl http://localhost:8080/fizz-buzz/foo
{"error":"Invalid numeric parameter java.lang.NumberFormatException: For input string: \"foo\""}

❯ curl http://localhost:8080/fizz-buzz/10
{"result":[1,2,"Fizz",4,"Buzz","Fizz",7,8,"Fizz","Buzz"]}
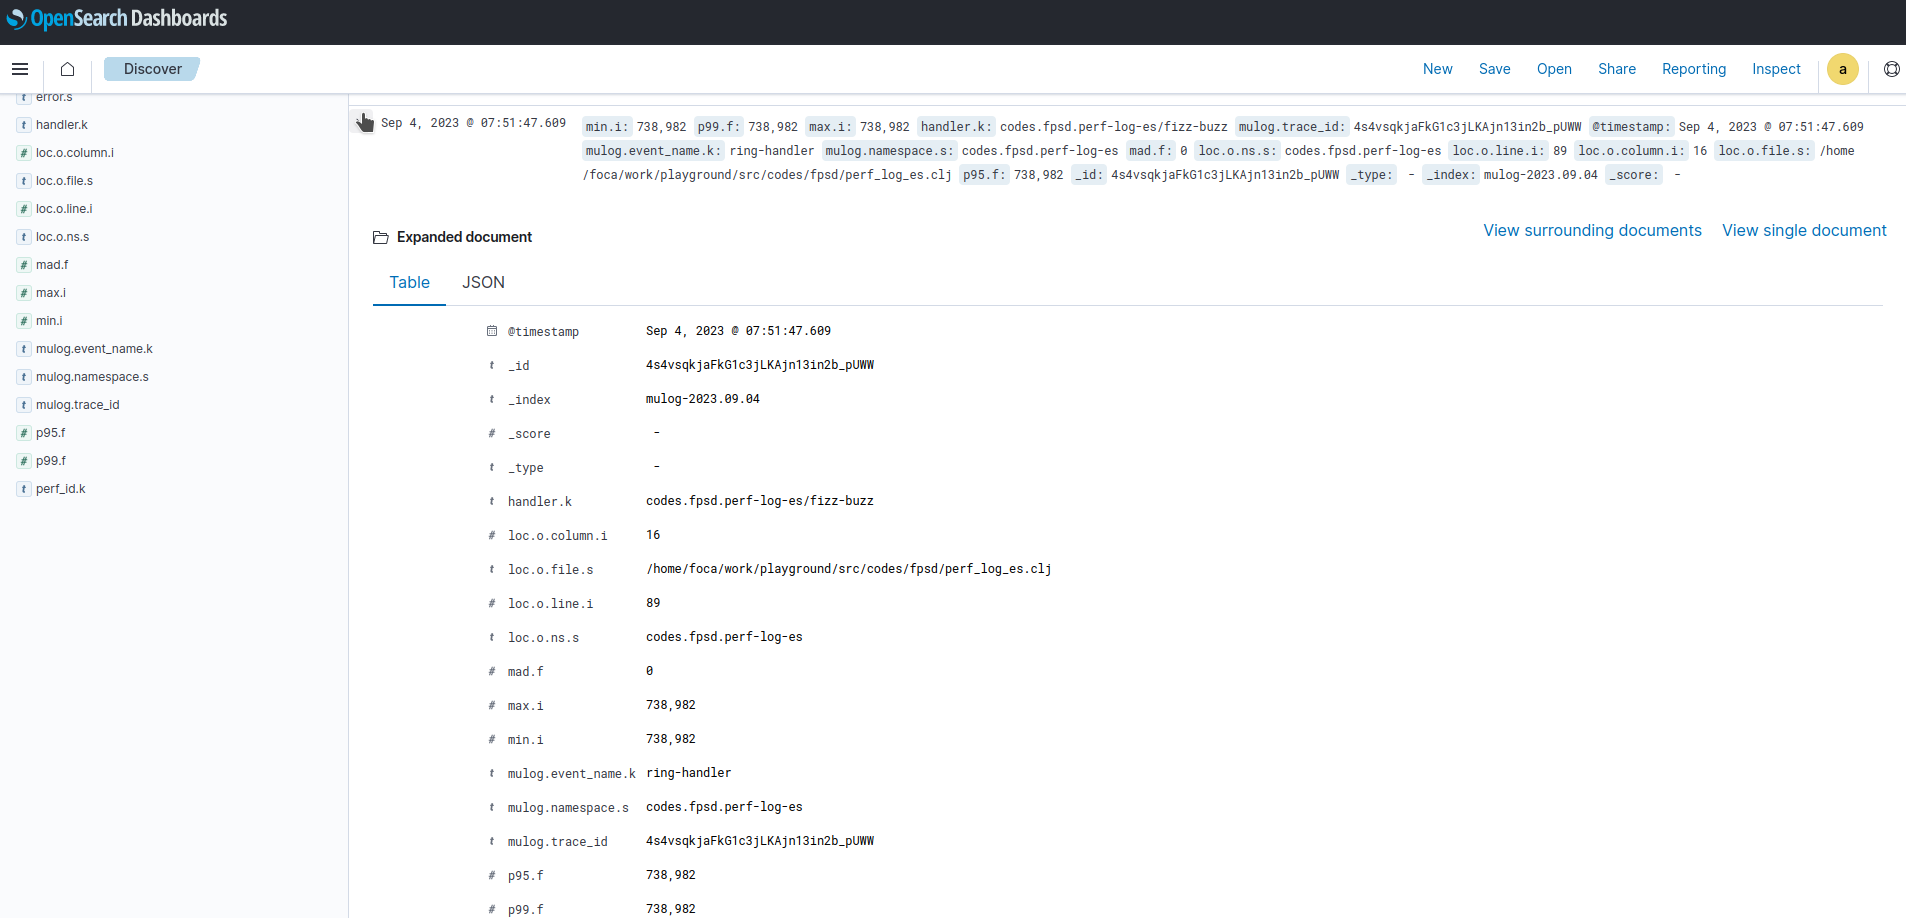
After poking the endponits for a bit we should accumulated some stats and we should be able to look at opensearch dashboard to inspect logs and potentially create views and alerts, here is an example:

The code supporting this post can be found here.
Conclusions
In this post we have seen how we can collect informations about our running system and send them to a convenient place for subsequent analysis, to setup alerts or created beautiful visualizations. I did skip soe details, for example how to configure integrant, mulog or opensearch and I suggest to refer to their own documentation.
As a side note I think this post was a bit too big for a Clojure Bite issue, touching too many arguments without focusing on one topic specifically. But I was already too late when I've discovered this problem so the post it is what it is :D
Discuss
Updates
From comments in Reddit I've learnead about alternatives for profiling and tracing
clj-async-profiler (comment)
clj-async-profiler, a much more accurate tracing profiler; probably best suited when developing and not in production, but still one more good tool to keep in mind.
Edit:
Looking at the README it looks like it is suitable for production environments too:
During profiling, clj-async-profiler has very low overhead, so it is suitable for usage even in highly loaded production scenarios.
mulog (comment)
mulog itself can create traces (using u/trace) for more fine grained metrics; the tradoff is that the number of events to be recorded can be very high and tufte's accumulated stats can mitigate this problem. Both tufte and mulog support conditional profiling/logging (for example via sampling) which can help to keep the number of events under control.